
Before we ask whether a programme works, we ask a question that most giving skips entirely: which problem is the right one to work on in the first place?
It is not a comfortable question, because a serious answer means being willing to pass over problems that are genuinely severe. But the choice is unavoidable. A funder with finite capital is always prioritising, whether or not they admit it; declining to choose explicitly simply means the choice gets made by default, through habit, proximity, or whoever asked most persuasively. We would rather make it deliberately. So before we recommend where a dollar should go, we put the decision through four filters, and what follows is each in turn, including the points where it proved harder than we expected.
The four filters, in short
- Choose the cause area. Where an additional dollar shifts the outcome most, not where need is loudest.
- Interrogate it. The NLIO lens, Need, Leverage, Interventions, Operators.
- Check the data against reality. Desk findings tested against people who work on the ground.
- Hold the evidence bar. A fixed standard, even when the cleanest study was run abroad.
Choosing where to work
We did not select our first cause areas by asking where the need was greatest, and the reason is worth setting out, because it runs against most people’s instinct.
Severity, on its own, is a poor guide to where philanthropic money does the most good. A problem can be acute and still be a weak place to give if the surrounding conditions are wrong: if the sector lacks the maturity to absorb funding well, if no intervention has yet been shown to work, or if no organisation exists that could deliver one at quality. The framework we borrow from effective giving separates three things that severity alone collapses together: importance, neglectedness, and tractability. A cause can rate highly on importance and still be a poor use of the marginal dollar if that dollar changes little, either because the problem is already well funded or because the available solutions are weak.
Severity tells you a problem matters. It does not tell you that an additional dollar will change the outcome. Importance, neglectedness, and tractability are separate questions, and a cause can score high on the first while failing the other two.
We assessed six cause areas against four criteria that try to capture those conditions: how mature the sector is, how much funding already flows to it, how enduring the problem is likely to remain, and how closely it aligns with government priorities (which shapes whether philanthropy can crowd in far larger public spending). Mental Health, Air Quality, Water and Food Systems, and One Health each cleared the shortlist. Two came through the full assessment: Early Childhood Care and Education, and Income Enhancement for smallholder farmers. Both combine an enduring problem, existing funding pathways to build on, real policy salience, and enough sector maturity that additional money has somewhere productive to go.
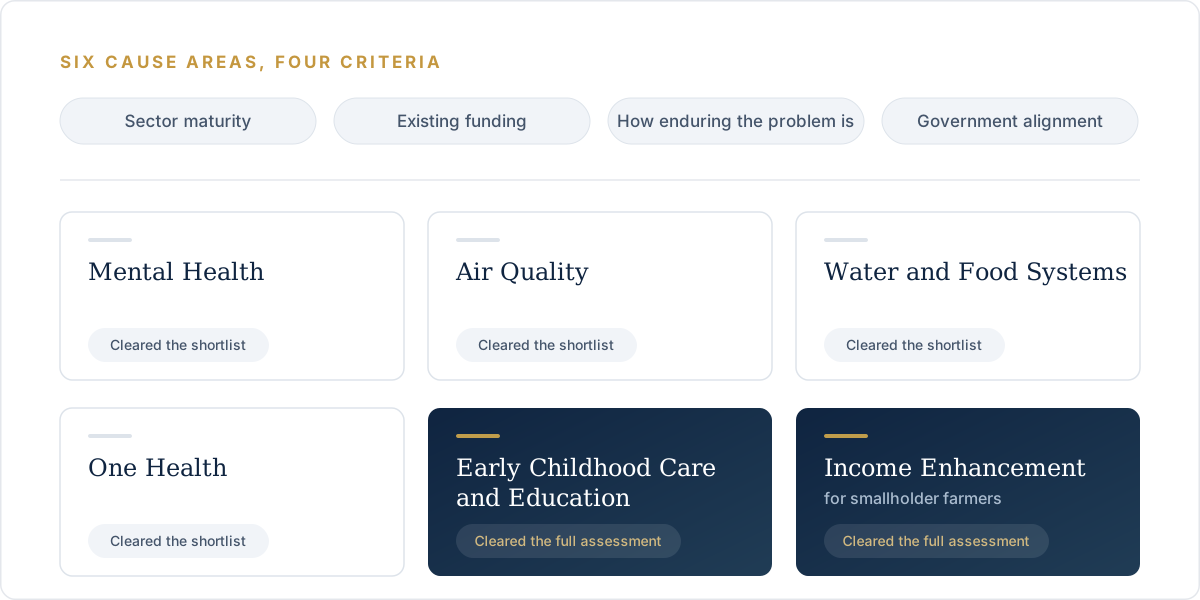
The hard part was disciplining ourselves against severity. Each of the six is a serious problem, and setting them in any kind of order feels uncomfortable. But prioritisation is not a ranking of which problem matters most in principle. It is an assessment of where an additional dollar shifts the outcome furthest, and holding that distinction steady is what keeps the exercise honest.
Interrogating the cause area
Selecting early childhood as our first deep dive told us where to look, not what to conclude. To interrogate the cause area rather than simply endorse it, we work through four questions we call the NLIO lens: Need, Leverage, Interventions, and Operators. The first two can be answered from data alone, before speaking to anyone.
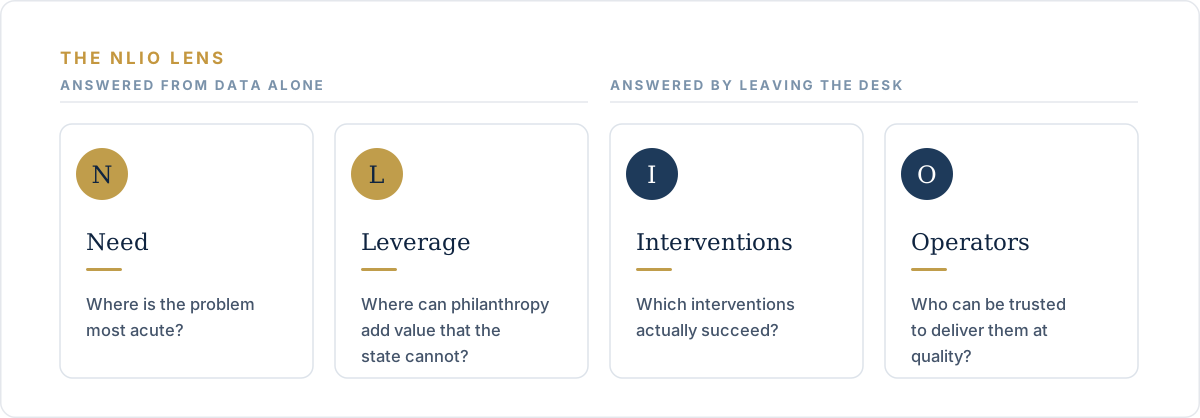
Need asks where the problem is most acute, and it produced our first genuine surprise. Maharashtra has the highest concentration of CSR funders in the country, yet it underperforms on 11 of 17 child well-being indicators, among them stunting, wasting, infant mortality, and pre-school attendance. One of India’s wealthiest states is falling short on its youngest children, which is not where most funders would expect the need to be greatest.
Leverage asks a more pointed question: where can philanthropy add value that the state cannot? The figures reset our expectations. Government spends in the region of USD 1.8 billion a year on early childhood in Maharashtra. Philanthropy contributes roughly USD 6.1 million, on the order of 0.3% of the total, a ratio of more than three hundred to one.
~USD 1.8B in government spending a year, against ~USD 6.1M from philanthropy, about 0.3%. At that ratio, philanthropy’s role cannot be volume. Its advantage is leverage: funding what the system won’t attempt, and proving what it could later scale on its own far larger budget.
That ratio settles what philanthropy’s role here can sensibly be. It cannot out-spend the state, and directing its small share toward sheer volume would waste the one advantage it has. Reading the 0.3% figure moved us from thinking about coverage to thinking about catalytic effect, and reframed the entire cause area.
Need and Leverage establish where to work and why. They say nothing yet about which interventions succeed, or who can be trusted to run them. Answering that meant leaving the spreadsheet behind.
Checking the data against reality
Our secondary analysis returned a result that initially read like an error. It flagged Thane, Pune, and Kolhapur, three of Maharashtra’s most prosperous districts with substantial public and philanthropic spending, as underperforming on child health. On the face of it the finding made little sense, since prosperous districts are not where one expects children to be failing.
Discarding it as noise would have been the easy move. Instead we did what we now treat as standard practice before trusting any desk finding: we tested it against people who work in these districts. Over the course of the cause area we consulted a range of practitioners and researchers whose daily work bears directly on the question: a senior leader at one of India’s largest education non-profits, a physician who has published on immunisation coverage in Pune, a former senior state health official in Maharashtra, a community-medicine researcher who has studied Anganwadi attendance in Mumbai, and a former director of a national population-sciences institute.
They confirmed the finding and explained what the aggregate figures were concealing. Prosperous districts contain large urban-slum populations and fast-growing peri-urban outskirts, and those pockets are often the least served in the district. The district average sits high precisely because the surrounding affluence is real, and that average masks the households in greatest need. Prosperity and neglect coexist within a few kilometres of each other, and from the altitude of a district-level statistic only the prosperity is visible.
Thane, Pune, and Kolhapur look well-served on paper. District averages sit high because the surrounding affluence is real, masking the urban-slum and peri-urban households in greatest need. Prosperity and neglect coexist within a few kilometres; only the prosperity is visible from a district-level statistic.
This is why secondary data is never where we stop. Quantitative analysis directs attention to the right places; domain experts tell us whether we are reading those places correctly, and surface the mechanisms a dataset cannot capture, that is, how a problem actually behaves in the field. Those same conversations serve a second purpose, helping us distinguish interventions that genuinely work from those that merely present well.
Early childhood interventions fall into four broad categories: awareness, such as counselling on infant feeding and newborn care; capacity building, which strengthens the skills of frontline workers; systems strengthening, which improves how existing services are delivered; and direct beneficiary transfer, which puts resources straight into families’ hands.
The allocation pattern across these categories is where the analysis becomes uncomfortable. Around 60% of philanthropic funding for early childhood in India flows to infrastructure and direct delivery, while the available evidence points to awareness and systems interventions as considerably more cost-effective per outcome, in several cases by close to an order of magnitude. The categories that attract the most money are frequently not the ones that convert money into outcomes most efficiently. For each intervention type we build a full cost-effectiveness model comparing cost per outcome, an exercise substantial enough that it warrants a blog of its own.
~60% of India’s early-childhood philanthropy goes to infrastructure and direct delivery, while the evidence points to awareness and systems interventions as more cost-effective per outcome, in several cases by close to an order of magnitude. The best-funded category is often not the most efficient one.
That leaves the final question in the lens: who can actually deliver? An intervention with strong evidence behind it is still only as good as the organisation implementing it, so we map the credible operators, those with the reach, the implementation fidelity, and the track record to carry it out in practice. Only once all four questions have answers, Need, Leverage, Interventions, and Operators, do we consider our picture of where philanthropy can move the needle to be defensible.
Holding the evidence bar
A promising intervention in the hands of a capable operator is still not, by itself, a recommendation. The evidence has to clear a threshold first, and this is where working in India becomes genuinely difficult, because the strongest evidence for what works here has usually been generated somewhere else.
We rank evidence by how much weight it can bear, from meta-analyses and systematic reviews at the top, through randomised controlled trials, quasi-experimental studies, cohort studies, and pre-post studies, down to expert consensus at the base. The higher a claim sits on that ladder, the more confidently we can act on it.
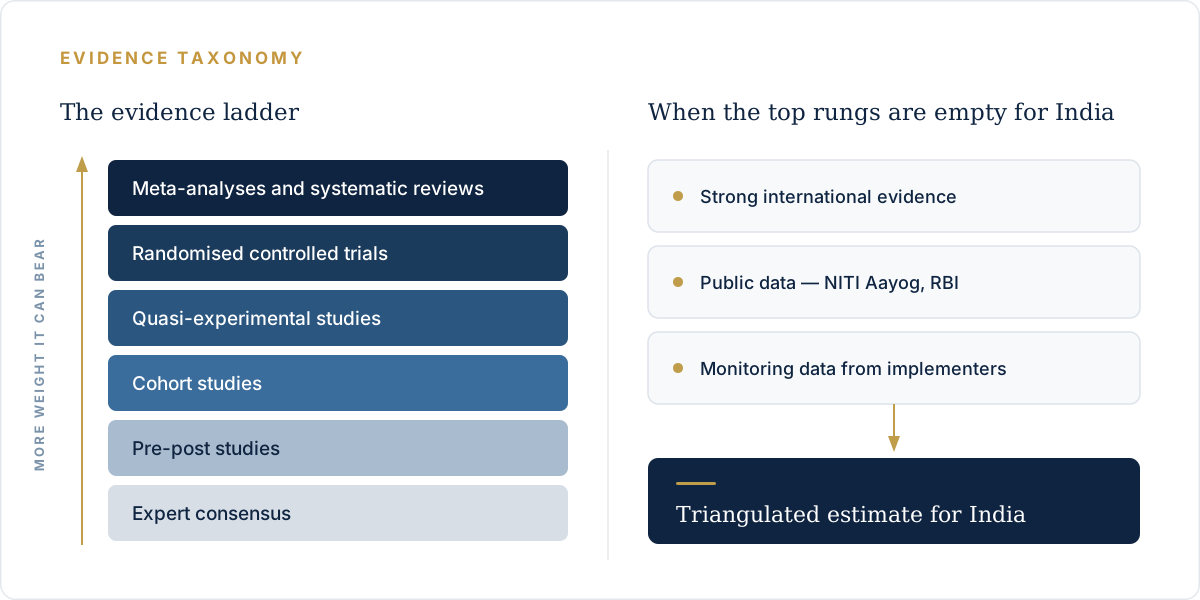
For a great many interventions in India, the upper rungs are simply empty, because the rigorous trials were conducted abroad. We treat that neither as a reason to give up nor as a reason to relax the standard. Instead we widen the base of what we are prepared to draw on, triangulating strong international evidence with public data from bodies such as NITI Aayog and the RBI, and with monitoring data from the organisations doing the implementing.
The discipline lies in holding two commitments at the same time: taking the best available evidence seriously wherever it was produced, while staying honest that an effect measured in one setting seldom carries over cleanly to another. The second commitment is the demanding one, and it is precisely where cost-effectiveness estimates tend to fail quietly.
An example makes the point concrete. We were building the case for Kangaroo Mother Care, sustained skin-to-skin contact for underweight newborns, among the most evidence-backed and low-cost interventions in newborn survival. What we needed was a single figure for how much it lowers a newborn’s risk of death, grounded in evidence that would hold for Maharashtra. The figure cited almost everywhere is a 40% reduction in mortality. It is a real result, but it is pooled from a subset of global trials spanning very different health systems, and in several of them it is unclear whether the comparison arm received the same breastfeeding support as the treatment arm. Taken at face value, 40% represents a best case drawn from elsewhere, and it almost certainly overstates what a Maharashtra ward operating at real-world compliance would achieve.
So we treated 40% as a ceiling rather than an estimate, and applied three discounts to it: one for the skin-to-skin contact that already happens informally in Indian wards, which narrows the counterfactual gain; one for the proportion of newborns who would actually receive the intervention once a programme scales beyond a trial setting; and one for the share of the mortality benefit attributable to Kangaroo Mother Care itself rather than to the bundle of care it usually travels with. Compounded, those adjustments brought our working estimate down to roughly 14%, a little over a third of the headline number.
The headline global figure for Kangaroo Mother Care is a 40% mortality reduction. Treated as a ceiling and discounted for informal existing practice, real-world coverage, and attribution to KMC alone, our working estimate for a Maharashtra ward is ~14%, a little over a third of the headline. A global effect size is a starting prior, not an answer.
The point of the exercise is calibration, not skepticism for its own sake. A global effect size is a starting prior, not a finished answer, and the work that matters is adjusting it for local conditions one assumption at a time.
What this adds up to
The recommendation comes last, after the filters have done their work. The process is slow and largely unglamorous, and that is the cost of producing a recommendation we can stand behind rather than one that merely sounds right.
How we get to a recommendation
- Choose the cause area on leverage, not severity alone.
- Interrogate it through Need, Leverage, Interventions, Operators.
- Test the analysis against people who know the terrain.
- Hold the evidence to a fixed bar, wherever the study was run.
Rigour in an evidence-scarce context is not a matter of waiting for perfect evidence, which rarely arrives. It is a matter of working carefully with imperfect evidence, being explicit about what remains uncertain, and being willing to leave the desk to narrow that uncertainty. That discipline is what we are actually offering.
This is the approach we’re taking. If it resonates with your giving priorities, we’d be glad to hear from you: info@raisingimpact.org